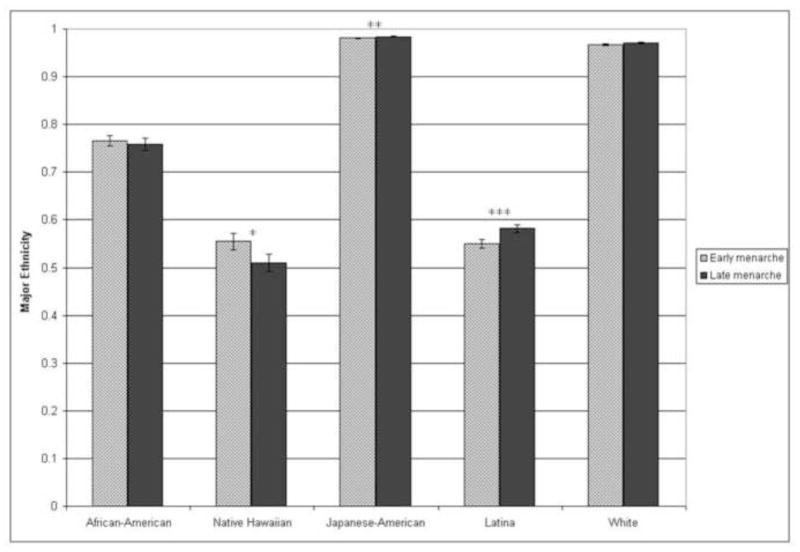
Figure 2. Genetic ancestry and age at menarche.
Mean ancestry estimates for each self-reported racial/ethnic group separated by early and late menarche. The “major ethnicity” on the y-axis represents the estimated contribution of the ancestry that has the largest contribution to a given self-reported ethnic group. For African-Americans, major ethnicity is estimated West African ancestry; for Native Hawaiians, major ethnicity is estimated Native Hawaiian ancestry; for Japanese-Americans, major ethnicity is estimated East Asian ancestry; for Latinas, major ethnicity is estimated European ancestry; for whites, major ethnicity is estimated European ancestry. ***p<0.01, **p<0.05, *p<0.1. Figure reproduced with permission from Journal of Clinical Endocrinology and Metabolism 93: 4290–4298. Copyright 2008, The Endocrine Society.

