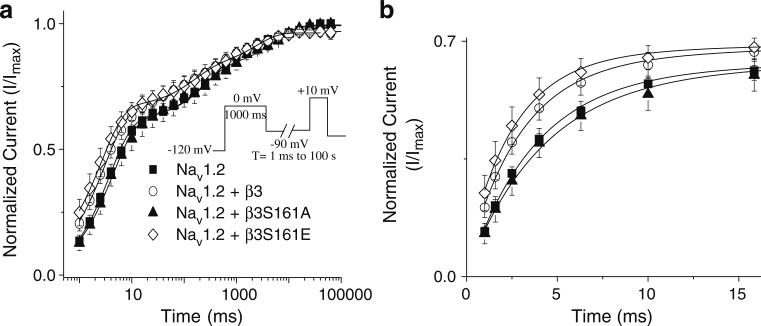
Fig. 3.
Recovery from inactivation at –90 mV. Recovery from inactivation was assessed at –90 mV using a two-pulse protocol. A pre-pulse from –120 to 0 mV was applied for 1,000 ms. Cells were then held at –90 mV for variable lengths of time (1 ms–100 s) to allow for channels to recover (a). WTβ3 and β3S161E both showed significantly faster rates of recovery of the first phase than did β3S161A. In b, an expanded time course further demonstrates the faster recovery trend for cells co-expressing WTβ3 and β3S161E when compared with Nav1.2 alone and β3S161A. Data points represent means ± SEM

