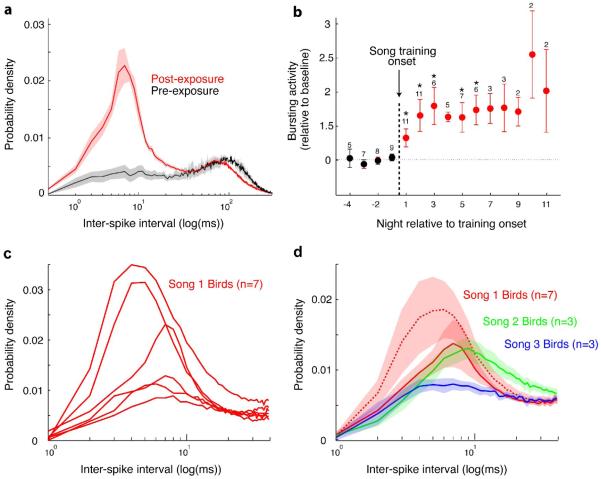
Figure 6. Changes in RA neuronal activity during sleep and the onset of juvenile song learning.
a) Interspike interval histogram (ISI) distributions for all 19 RA neurons recorded on three nights prior to the onset of tutor song exposure (black curve) and for all 59 cells on 12 following nights (red curve). Cells recorded in the period when the bird is learning to sing have much greater high frequency bursting. b) Data from all 13 birds recorded on nights prior to (black points) and following (red points) the onset of tutor song exposure. Bursting activity is quantified as the area under the ISIs from 1 - 40 ms, relative to the baseline area defined as the average of the four nights preceding the first post-tutoring night. Each point is the average (± s.e.m.) across all birds contributing to that night; the number above each point is the number of birds contributing to that point. For each bird the average was calculated across all cells recorded that night. Note that the amount of spike bursting increases on the first night following tutor song exposure and reaches a plateau by the second night. c) ISI distributions, one per bird averaged across all cells for that bird, from birds that learned one particular tutor song (“Song 1”). The magnitude of the curves varies but the shape (location and width of peak) is generally conserved. d) Comparison of means (± s.e.m.) of ISI distributions across three groups of birds, that learned either “Song 1” (red dashed curve), “Song 2” (green curve), or “Song 3” (blue curve). The ISI distributions vary depending on which tutor song the birds were exposed to. Eliminating the two “Song 1” birds with the greatest high-frequency bursting (see c) (red solid curve) preserves differences between “Song 1” and the other two tutor song types. (Modified from Shank & Margoliash 2009)

