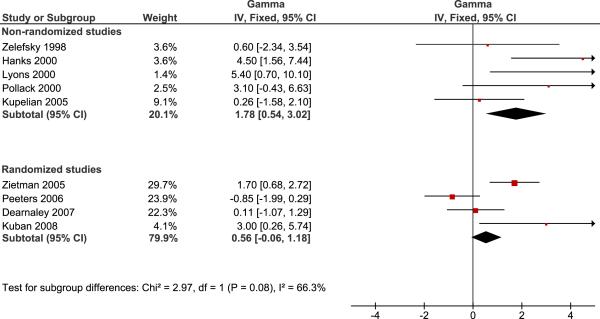
Figure 1.
Pooled analysis of studies reporting the steepness of the dose response curve for low risk patients. Non-randomized and randomized studies are analyzed separately using inverse variance weighting. Horizontal lines in the forest plot indicate the range of the 95% CI of individual studies, while the left and right corner of the diamond shapes depict the 95% CI of the combined estimate.

