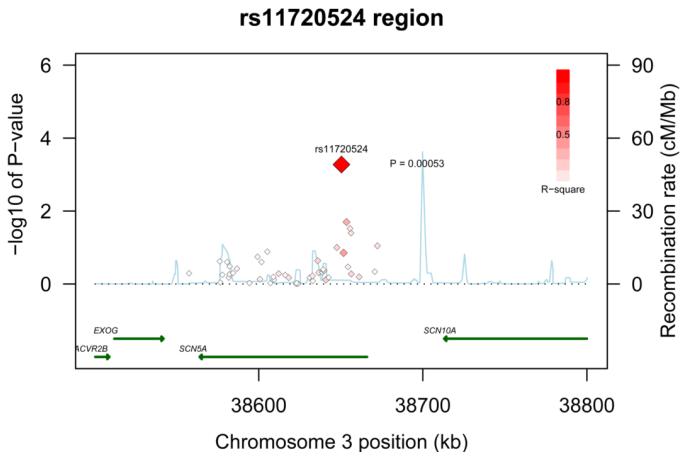
Figure 2. Regional association plot across SCN5A locus.
Statistical significance of associated SNPs at each locus are shown on the −log10(p) scale as a function of chromosomal position (NCBI Build 36). The primary associated SNP at the locus (rs11720524) is shown as a large red diamond. The correlation of the primary SNP to other SNPs (smaller diamonds) at the locus is shown on a scale from minimal (white) to maximal (bright red). Estimated recombination rates from HapMap and RefSeq annotations are shown.

