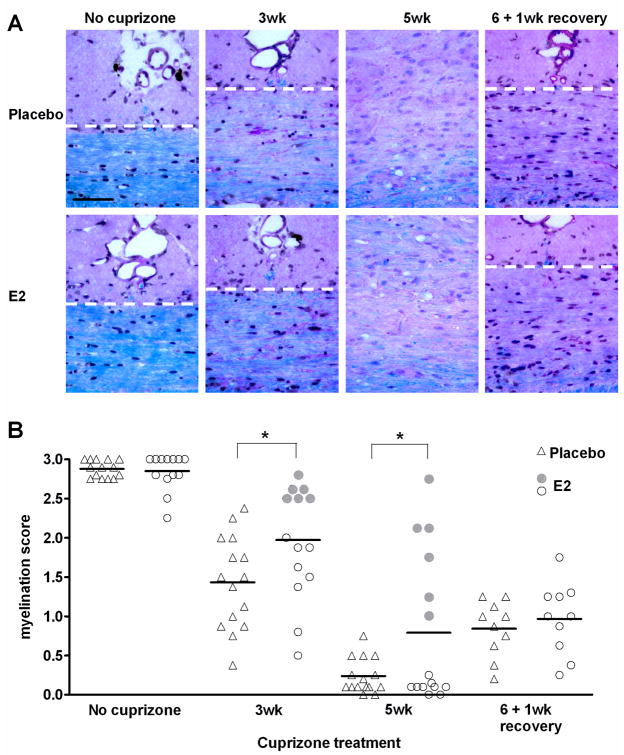
Figure 2. Demyelination and remyelination in placebo and E2-treated mice.
A. Representative images of LFB-PAS-stained midline corpus callosum sections. The corpus callosum is the area below the dashed white lines (except the 5wk images, in which the entire image encompasses corpus callosum). Scale bar represents 50 micrometers.
B. Myelination scores obtained by blind-scoring of midline corpus callosum sections stained with LFB-PAS. A score of 3 reflects normal myelination in an untreated mouse, whereas a score of 0 reflects the absence of myelin. Individual data points (triangle and round symbols) and mean values (horizontal bars) are plotted for 10–15 animals per group at each time point. * p < 0.05. At the 3 and 5 week time points, E2-treated mice showing the greatest protection from demyelination are indicated with filled circles so that they may be followed in subsequent figures of this manuscript..

