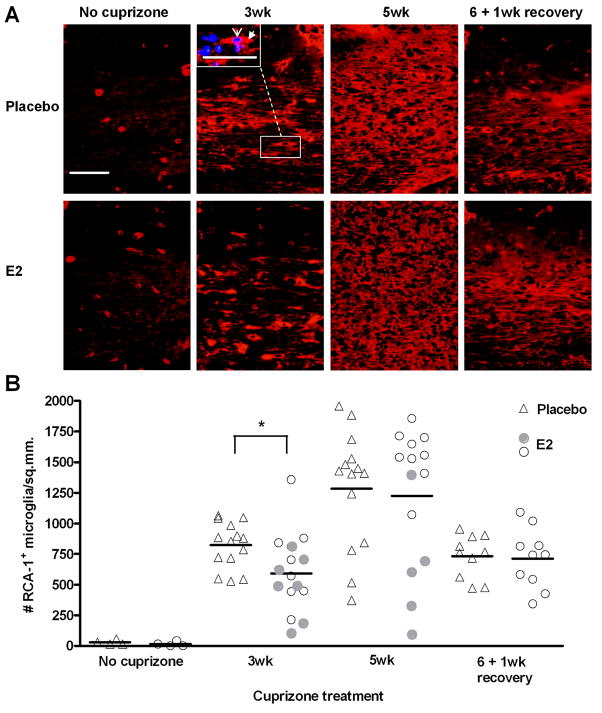
Figure 5. Accumulation of microglia during demyelination and remyelination in placebo and E2-treated mice.
A. Representative images of RCA-1+ microglia/macrophages in the corpus callosum of placebo and E2-treated mice during cuprizone administration and recovery. The inset in the 3wk cuprizone, placebo image shows an example of an RCA-1-positive cell (red, filled arrowhead) overlayed with DAPI nuclei counterstain (blue, open arrowhead). DAPI-overlayed images were used for quantification. Scale bar represents 50 micrometers.
B. Quantification of RCA-1+ microglia/macrophages. Individual data points and mean bars are plotted for 10–15 animals per group at each time point. * p < 0.05. At the 3 and 5 week time points, E2-treated mice that exhibited the greatest protection from demyelination (Figure 2B) are indicated with filled circles.

