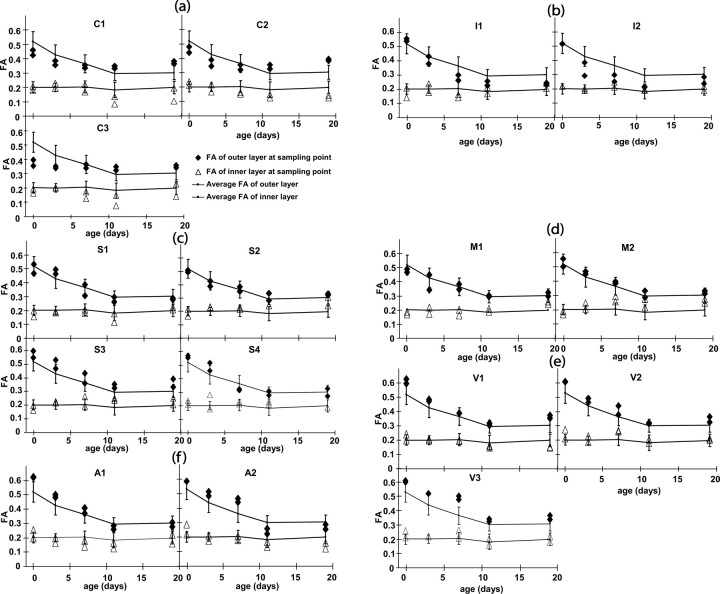
Figure 4.
FA measurement results from various cortical regions during the P0–P19 period. The FA values averaged over all sixteen measurement points are shown as reference curves, with error bars indicating SDs. a, The cingulate (C1, C2) and the prelimbic (C3) cortices; b, the insula cortex (I1, I2); c, the somatosensory cortex (S1–S4); d, the motor cortex (M1, M2); e, the visual cortex (V1–V3); and f, the auditory cortex (A1, A2).

