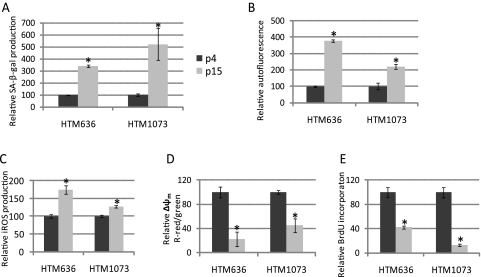
Figure 1.
Evaluation of cellular senescence markers in two replicative senescent HTM cell lines. Two HTM (636-07-22 and 1073-07-26) cell lines showed significant expression of senescence markers at p15. Induction of SA-β-gal (A), autofluorescence (B), iROS (C), and Δψm (D) in p15 versus p4 cells was quantified by flow cytometry. The cell proliferation rate (E) was quantified by BrdU incorporation. Data represent the mean percentage change ± SD, n = 3. *P < 0.05, compared with p4 cultures; Mann–Whitney U test.

