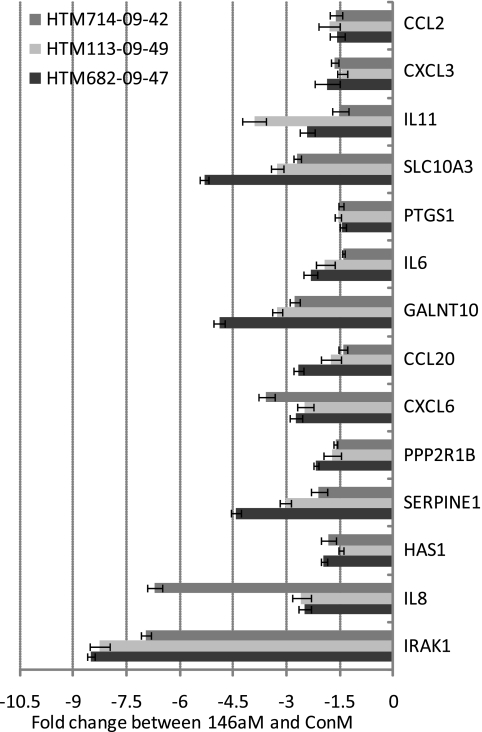
Figure 3.
Genes downregulated by miR-146a in three independent HTM cell lines. Three additional individual HTM cell lines (714-09-42, 113-09-49, and 682-09-47) were transfected with 146aM and ConM. Three days later, total RNAs were isolated, and q-PCR was performed with SYBR green master mix with specific primers (Table 1). The results were normalized with β-actin, and the gene expressions in 146aM-transfected cells were expressed as the change in levels of specific genes relative to that in ConM-transfected cells. Data represent the mean change ± SD, n = 3. P < 0.05, compared with ConM transfected cells; Mann–Whitney U test.

