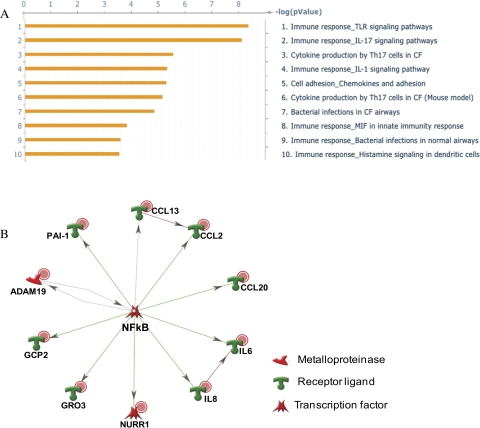
Figure 5.
Pathway analysis of the genes showing changes in expression higher than twofold with P < 0.05 in the gene microarrays. (A) The pathways identified as the more significantly affected by miR-146a at a threshold of 0.001 and P = 0.05. (B) The NF-kB transcription regulation subnetwork. NF-kB was identified as the transcription factor with the highest ranking in terms of P-value and gene ontology interpretation with 12 nodes, 11 root nodes; P-value of 7.10e-36, z-score of 129.23, and g-score of 129.23. Red dots: downregulation in the gene array analysis; green symbols: induction; red symbols: inhibition; gray arrows: unspecified interaction.

