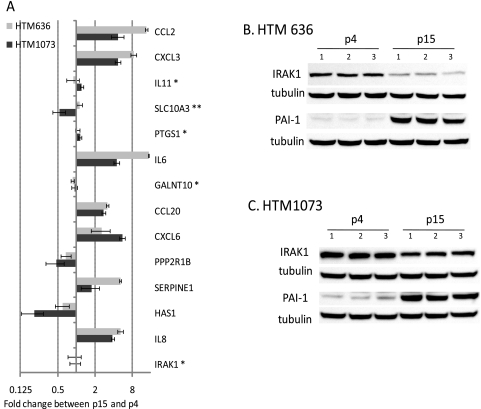
Figure 6.
Identification of components of the SASP in HTM cells regulated by miR-146a. Total RNAs (500 ng) isolated from p4 and p15 of HTM cell lines (636-07-22 and 1073-07-26) were reverse transcribed and amplified with specific primers (Table 1) and SYBR green master mix. Relative expression was calculated by the comparative cycle threshold method and normalized relative to human β-actin. Results from p15 are expressed as the change in RNA levels relative to p4 cultures. Data represent the mean changes ± SD, n = 3. P < 0.05 compared with p4 cultures; Mann–Whitney U test. (A) **No significant change in one cell line; *no significant changes in any of the cell lines. Total proteins were isolated from p4 and p15 of HTM cells lines (B) 636-07-22 and (C) 1073-07-26), n = 3. Western blot analysis was conducted with 8% SDS PAGE, and the membrane was stained with IRAK1- and PAI-1-specific antibodies. The same membrane was stripped and restained with β-tubulin (B, C).

