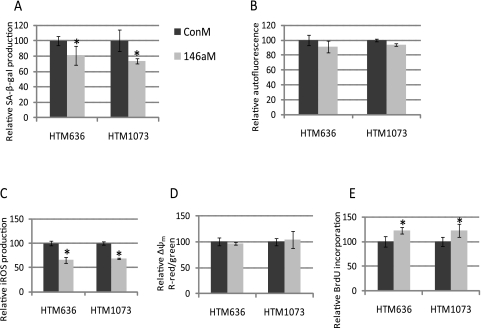
Figure 7.
Effects of miR-146a on the expression of cellular senescence markers in HTM cells. Two HTM (636-07-22 and 1073-07-26) cell lines p11 transfected with 146aM or ConM. Induction of SA-β-gal (A), autofluorescence (B), iROS (C), Δψm (D) in 146aM-transfected cells (146aM) versus ConM-transfected cells (ConM) were quantified by flow cytometry. The proliferation rate (E) was quantified by BrdU incorporation. Data show the percentage of increase or decrease compared with their individual ConM-transfected cells and represent the mean percentage change ± SD, n = 3. *P < 0.05, compared with ConM-transfected cells; Mann–Whitney U test.

