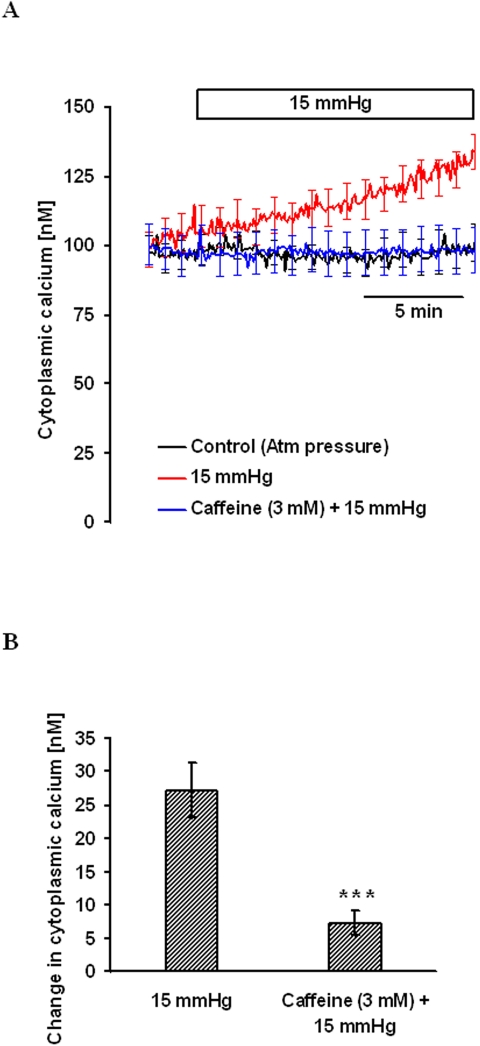
Figure 7.
Effect of hydrostatic pressure on [Ca2+]i in cells pretreated with 3 mM caffeine for 15 minutes in nominally calcium-free solution. After establishing stable baseline [Ca2+]i, pressure was increased to 15 mm Hg, and [Ca2+]i was monitored continuously for 15 minutes. Control cells were kept at atmospheric pressure. (A) Record of [Ca2+]i concentration measured over time. (B) Changes in [Ca2+]i concentration measured 15 minutes after the onset of the pressure increase. Results are mean ± SEM of 3 to 5 independent experiments. [Ca2+]i was measured every 10 seconds, but for clarity the SEM values are only shown at 1-minute intervals in (A). ***P < 0.001; significant difference compared with pressure-treated cells.

