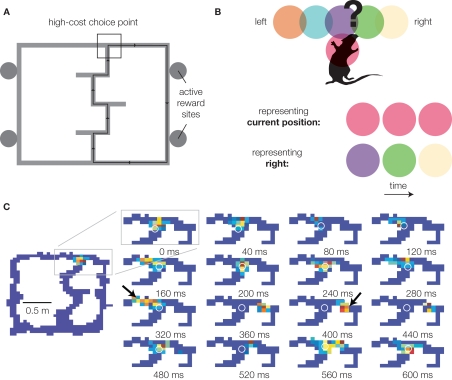
Figure 1.
Representation of forward possibilities at the choice point of the Multiple-T maze. (A) The Multiple-T maze. Rats are trained to run laps on an elevated track for food reward. Only one side (right in this example) is rewarded in any given session, but which side is varied between sessions, such that rats start out uncertain about the correct choice. Over the first 10 laps, choice performance increases rapidly, coincident with a tendency to pause at the final choice point (van der Meer and Redish, 2009a). Over the course of a session, rats continue to refine their path, indicating learning beyond choice (Schmitzer-Torbert and Redish, 2002). (B) Decoding methods schematic. Neurons in the rat hippocampus tend to be active in specific places on the track: five such “place fields” (colored circles) around the choice point [black box in (A)] are shown. By observing which cells are active at any given time, we can infer what location is being represented. If the rat is simply representing its current location, the red cell will be active. In contrast, when the rat pauses at the choice point, activity from the purple, green, and yellow cells might be observed in sequence. This indicates the rat is representing a location distant from its current location (the right maze arm in this example) – a key component of planning. (C) Sequence of place representations decoded from actual neurons as the rat (location indicated by the white o) pauses at the final choice point. Red indicates high probability, blue indicates low probability. Note how even though the rat (o) stays stationary, the decoded probability sweeps down the left arm of the maze, then the right (arrows). Data from Johnson and Redish (2007).

