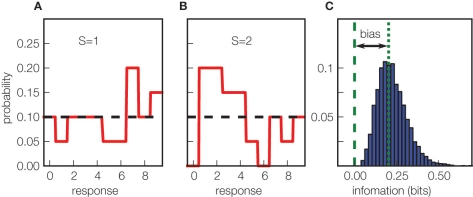
Figure 1.
The origin of the limited sampling bias in information measures. (A, B) Simulation of a toy uninformative neuron, responding on each trial with a uniform distribution of spike counts ranging from 0 to 9, regardless of which of two stimuli (S = 1 in (A) and S = 2 in (B)) are presented. The black dotted horizontal line is the true response distribution, solid red lines are estimates sampled from 40 trials. The limited sampling causes the appearance of spurious differences in the two estimated conditional response distributions, leading to an artificial positive value of mutual information. (C) The distribution (over 5000 simulations) of the mutual information values obtained (without using any bias correction) estimating Eq. 1 from the stimulus–response probabilities computed with 40 trials. The dashed green vertical line indicates the true value of the mutual information carried by the simulated system (which equals 0 bits); the difference between this and the mean observed value (dotted green line) is the bias.

