Figure 3.
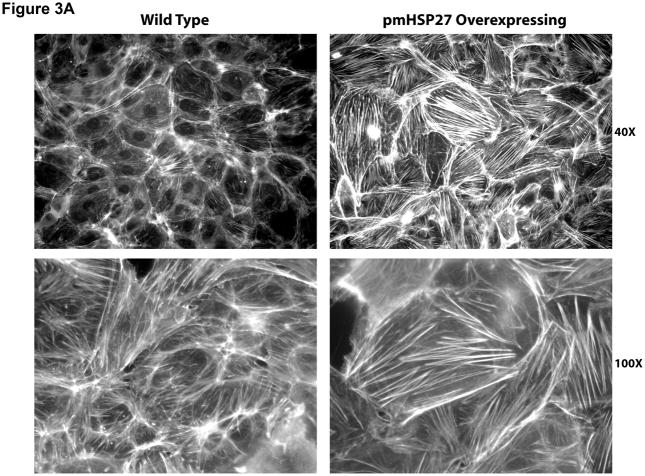
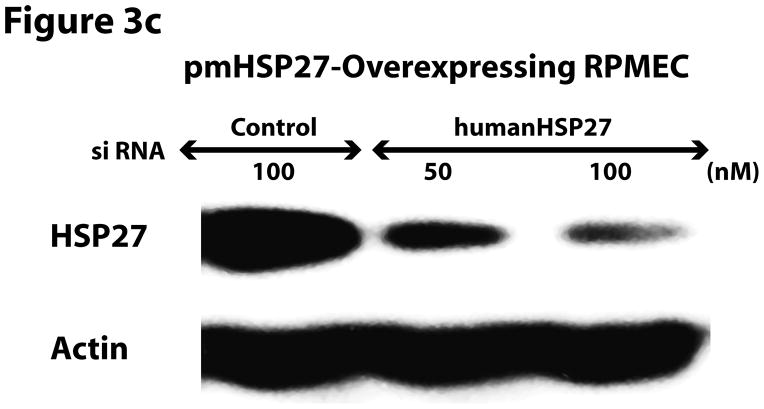
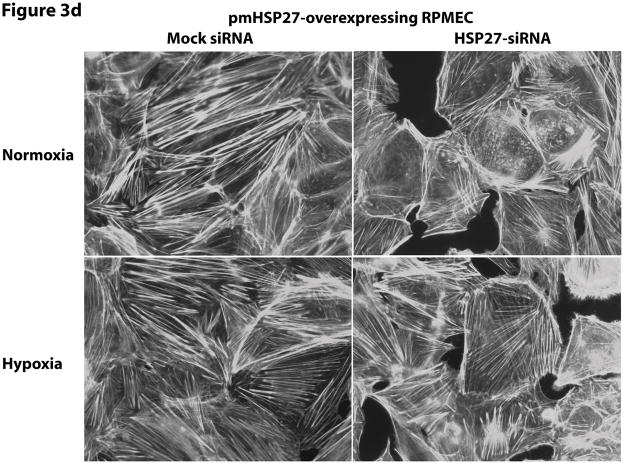
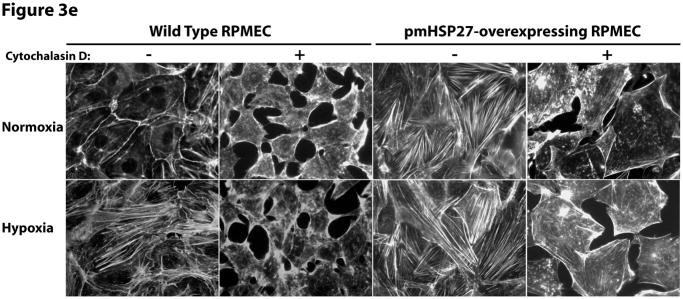
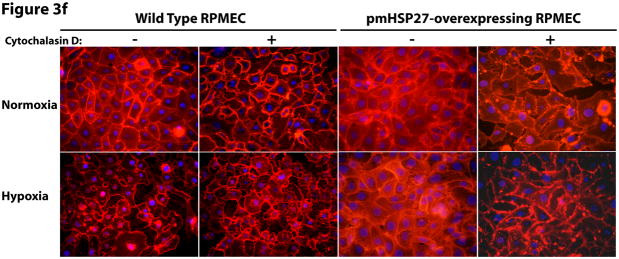
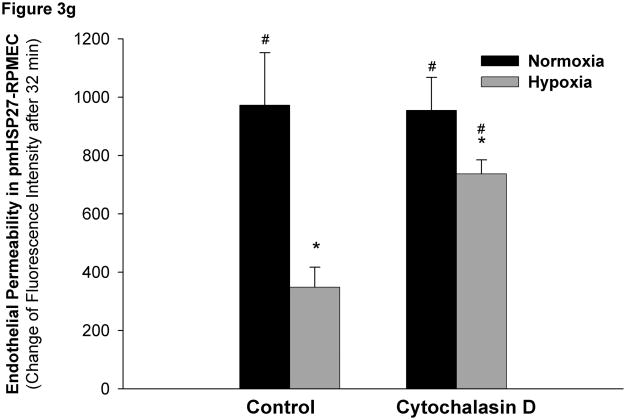
HSP27, actin stress fibers, and endothelial barrier integrity. (a) Over-expression of pmHSP27 increased the formation of actin stress fiber in PRMEC. pmHSP27-overexpressing RPMECs grown on coverslips were stained with Rhodamine-phalloidin for 20 min, actin stress fibers was visualized with fluorescence microscopy. (b) Human HSP27 siRNA did not affect the expression level of endogenous rat HSP27. Wild type RPMEC was transfected with human HSP27 siRNA and mock control siRNA, then protein level of HSP27 was assayed after 36 h by Western blotting. (c) Human HSP27 siRNA reduced the expression of pmHSP27 in pmHSP27-overexpressing RPMEC. Transfection was performed at the indicated concentrations of siRNA, then expression level of pmHSP27 was tested after 36 h by Western blotting. (d) Transfection of pmHSP27 siRNA attenuated the formation of actin stress fiber in pmHSP27-overexpressing RPMEC. After transfection of pmHSP27 siRNA, actin stress fibers were visualized in pmHSP27-overexpressing RPMEC grown on cover slips by Rhodamine-phalloidin staining. Magnification was 400X. (e) Cytochalasin D inhibited the formation of actin stress fiber. Stress fibers were visualized by Rhodamine-phalloidin staining after treatment with an inhibitor of actin filament formation, Cytochalasin D (2 μM) Magnification was 400X. (f) Cytochalasin D inhibited the formation of intercellular gaps. Gaps between cells were visualized with Image-iT LIVE Plasma Membrane and Nuclear Labeling Kit. Magnification was 400X. (g) Cytochalasin D reversed the reduced permeability in pmHSP27-overexpressing RPMEC. Permeability was tested after 32 min treatment with Cytochalasin D. Data are presented as means ± standard deviation (n =4 samples). * Statistically significant difference from normoxic control mean, # statistically significant difference from hypoxic control mean. P <0.05 in ANOVA and Holm-Sidak post hoc analysis.

