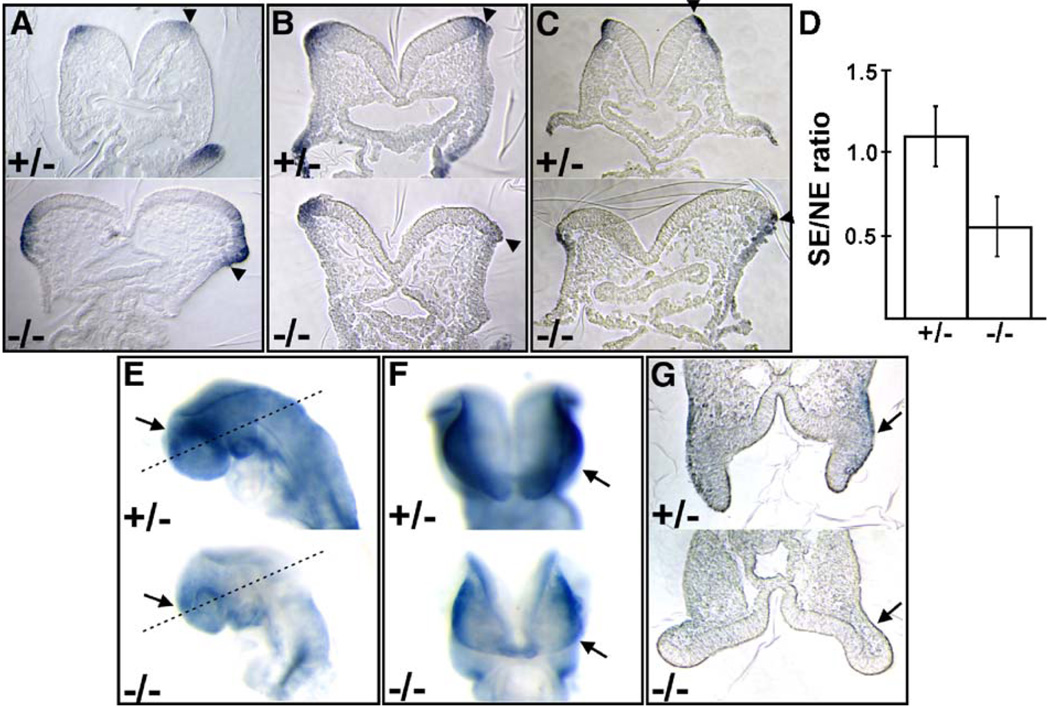
Fig. 6.
The lateral shift of the neuroectoderm/surface ectoderm border in Ovol2 mutant embryos is the result of expanded neuroectoderm and reduced surface ectoderm. (A–C) Transverse sections through embryos hybridized with Pax3 (A), Msx2 (B), and Wnt6 (C) probes. Arrowheads in panels A–C indicate the position of the neuroectoderm/surface ectoderm border. (D) Quantitative analysis of the ratio between surface ectoderm (SE) and neuroectoderm (NE) in control and mutant embryos. Bars represent average ratio determined from 11 control and 11 mutant sections through comparable cranial regions of a total of four embryos of each genotype. (E–F) Whole mount in situ hybridization using a Dlx3 probe. Lateral (E) and ventral (F) views are shown. Arrows indicate expression in the forebrain region of the control embryos that was weaker in the mutant. (F) Sections through different embryo pairs at planes indicated in panel D. Dlx3 was expressed in the surface ectoderm of control, but not mutant embryos (arrows).

