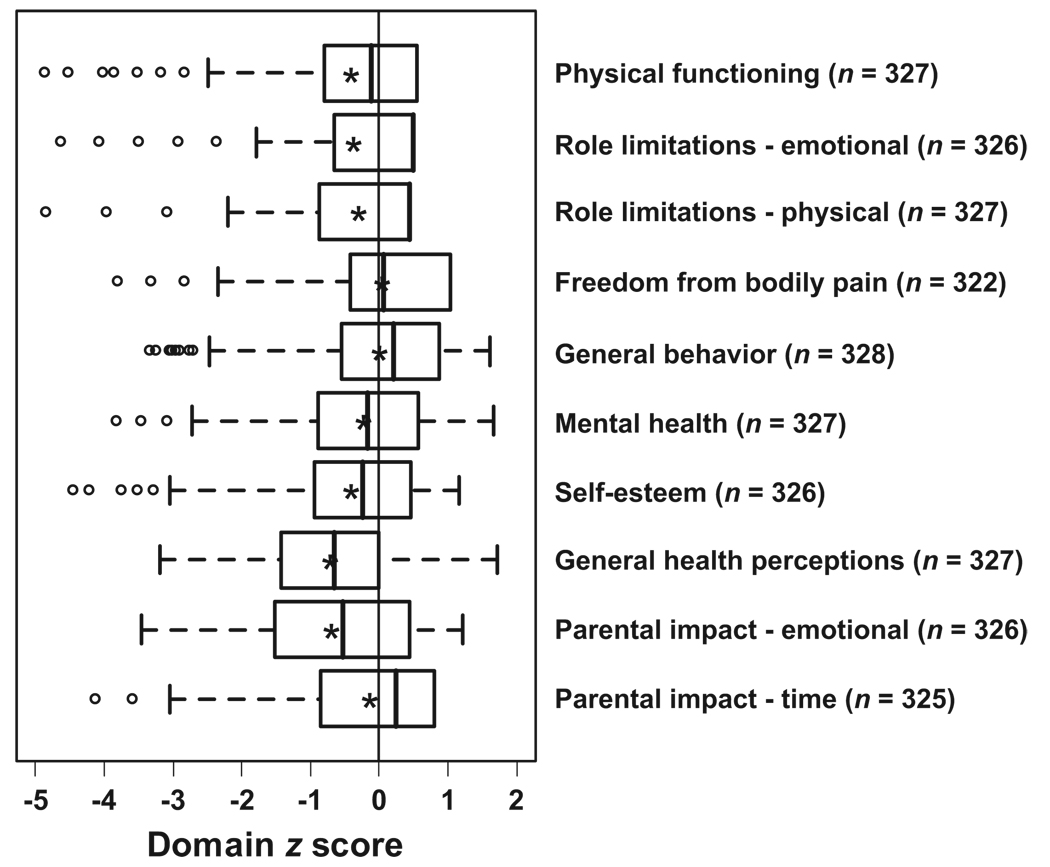
FIGURE 2.
Distribution of parent-completed CHQ (CHQ-PF50) domain z scores for the 328 subjects whose children completed the CHQ (CHQ-CF87). The middle line in each box indicates the median, asterisks indicate the means, the left and right edges of the boxes represent the 25th and 75th percentiles, respectively, and the whiskers indicate 1.5 times the interquartile range. Circles indicate outliers.

