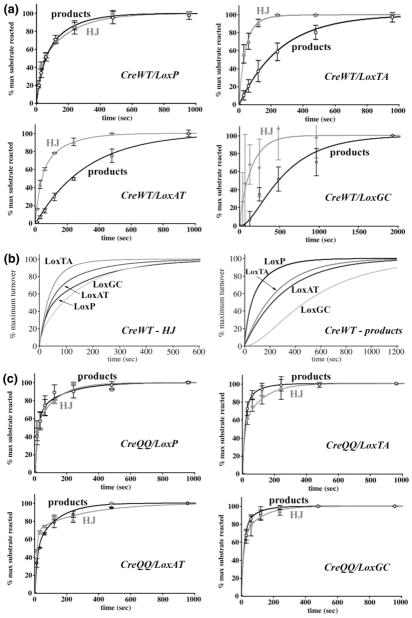
Figure 5.
Normalized HJ and product formation in time course reactions. The representative curves are normalized to 100%, using the maximum substrate turned over to HJ or products in each reaction as the normalization factor. The fit parameters are listed in Tables 3 and 4. (a) CreWT reactions. The time dependence of HJ formation is shown as gray curves/gray diamonds, and product formation as black curves/open circles. (b) Comparison of the time dependence of HJ formation (left panel) or product formation (right panel) in CreWT reactions. (c) CreQQ reactions. HJ formation is shown as gray curves/gray diamonds, and product formation as black curves/open circles.

