Figure 2.
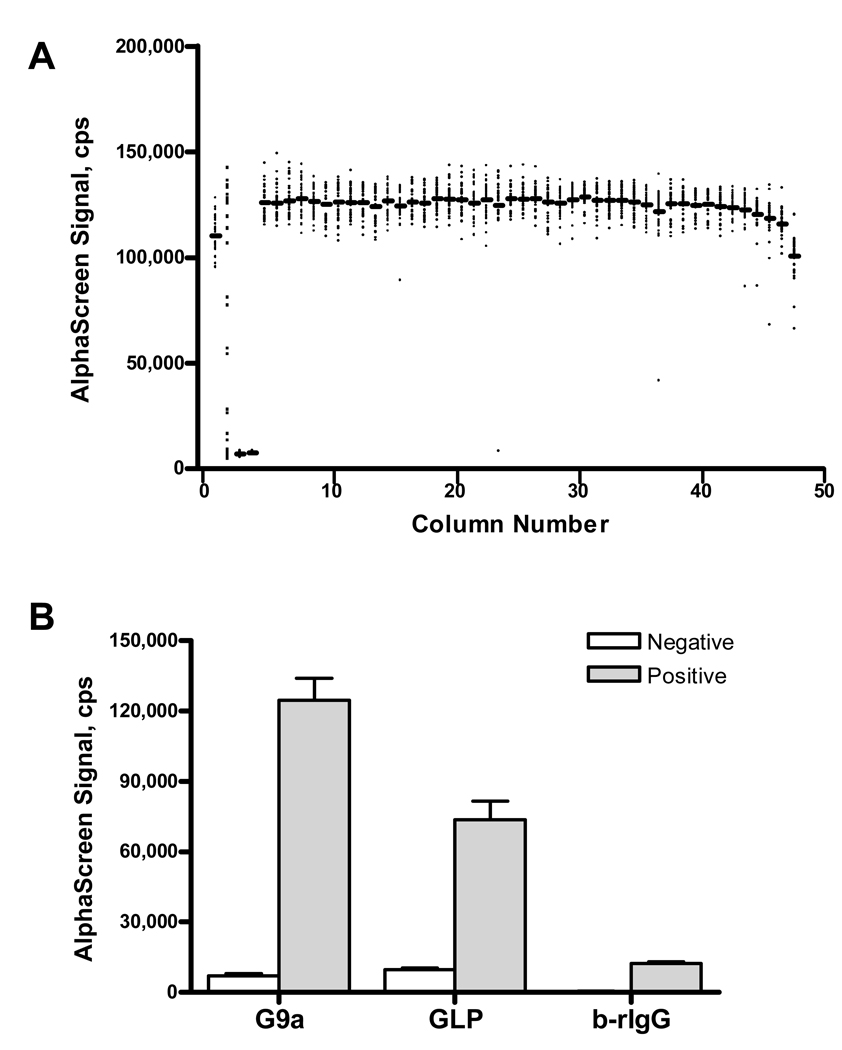
The histone methyltransferase assay was performed in miniaturized 1,536-well plate format with G9a and GLP methyltransferase enzymes. A, A scatter plot of AlphaScreen signal by column displays low background and high signal-to-background ratio. The mean value for each column (bars) is shown in addition to the signal in each well (points). Columns 1, 5–48 are G9a reactions, columns 3–4 are no enzyme controls, and column 2 contains a 16-point titration of BIX-01294, a G9a inhibitor. B, Methylation of H3K9 was measured for positive enzymatic or b-rIgG reactions (grey bars) and for negative no enzyme or protein controls (white bars). Values are displayed for the mean and standard deviation of 64 (negative control) and 1,440 (positive control) replicate measurements.

