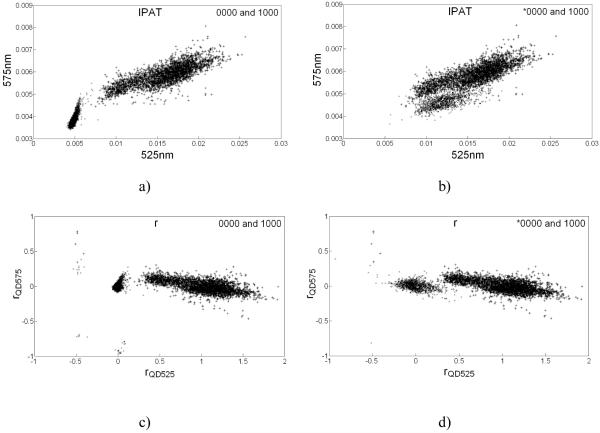
Figure 2.
Scatter plots explaining the rationale for utilizing r values instead of IPAT values to perform classification on assayed microspheres: a) and b) show scatter plots between IPAT values observed in 525nm and 575nm detection channels for classes 0000-1000 and *0000-1000, respectively; c) and d) represent rQD525 vs. rQD575 scatter plots for classes 0000-1000 and *0000-1000, respectively. Labeling with QD497 (*) brings the 0000 cluster lie very close to and overlap with 1000 cluster in scatter plots in IPAT space lowering the classification efficiency; however in r space *0000 and 1000 clusters remain well demarcated and classification efficiency is high. 0000 and *0000 clusters are marked with ‘×’, and 1000 clusters are marked with ‘+’.

