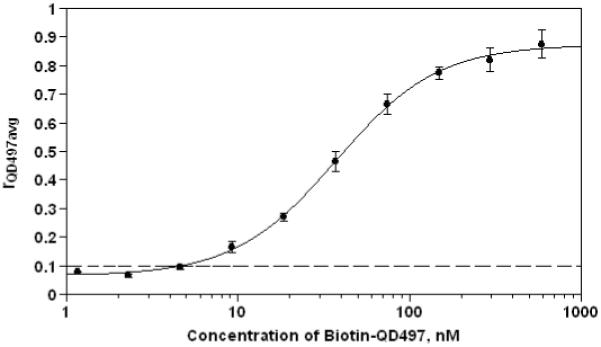
Figure 5.

Standard curve (model fitted as four-parameter logistic using SoftMax Pro v. 5.2) for QD497-tagged biotin was generated via microsphere-based immunoassay. Data was generated from standard dilutions at concentrations 592, 296, 148, 74, 37, 18.5, 9.25, 4.63, 2.31 and 1.16nM using duplicates for each concentration. Error bars denote the standard deviation between duplicates. Based on rQD497 = 0.1 as upper threshold for untagged microspheres (see Figure 3), marked by ‘---’, we observed that the lowest limit of detection for our SAv-Biotin assay system is ~ 4.63nM. For the generation of curve, microspheres from class 0001 were used for tagging with biotin-QD497.
