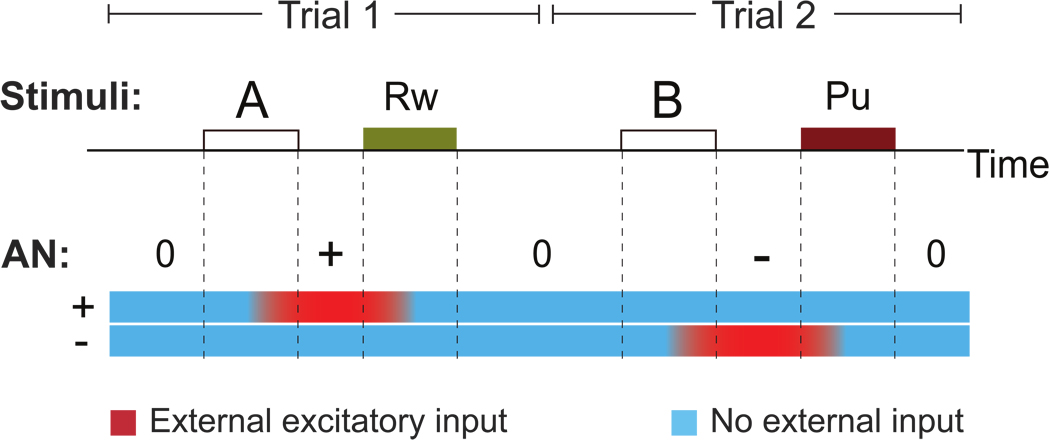
Figure 2.
Simulated activity of the AN during two trials of the trace conditioning task of Paton et al. (2006). During the first trial CS A is presented, followed by a reward. The AN network is initially in the neutral state ‘0’ in which all populations are inactive (the activity is color coded: blue means inactive, red means active). The presentation of CS A initiates a competition between the positive coding AN population ‘+’ and the negative coding population ‘−’ which, in this simulation, ends with the activation of population ‘+’. The delivery of reward resets the AN to the ‘0’ state. In the second trial CS B activates population ‘−’ and punishment resets it.

