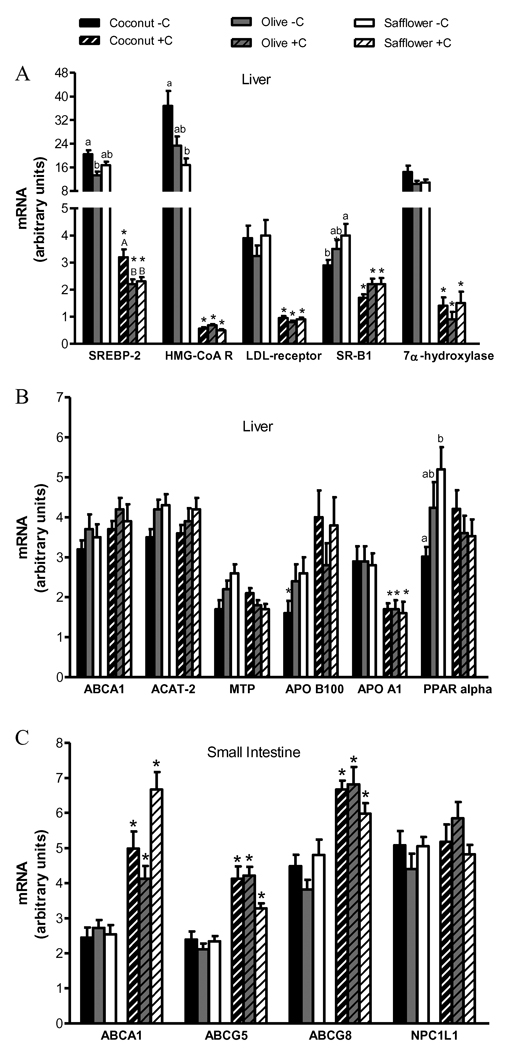
Figure 3.
Hepatic and small intestinal gene expression in response to alterations in cholesterol homeostasis and dietary fat type. Real time PCR was used to measure gene expression in the liver (A and B) and small intestine (C). Values are expressed as mean ± SEM, n=14–16 animals per group. Appropriate transformations of the data (log SREBP-2, CYP7A1, MTP, apo B-100, ABCA1, HMG-CoA R [HMG-CoA reductase]; square root SR-B1, SREBP-1c, apo A-I) were made before statistical analysis. Bars with different letters (lowercase for cholesterol-depleted, −C; uppercase for cholesterol-supplemented, +C) are significantly different, P≤0.05. Asterisks indicate significant differences between +C and −C hamsters within a dietary fat treatment, P≤0.05.

