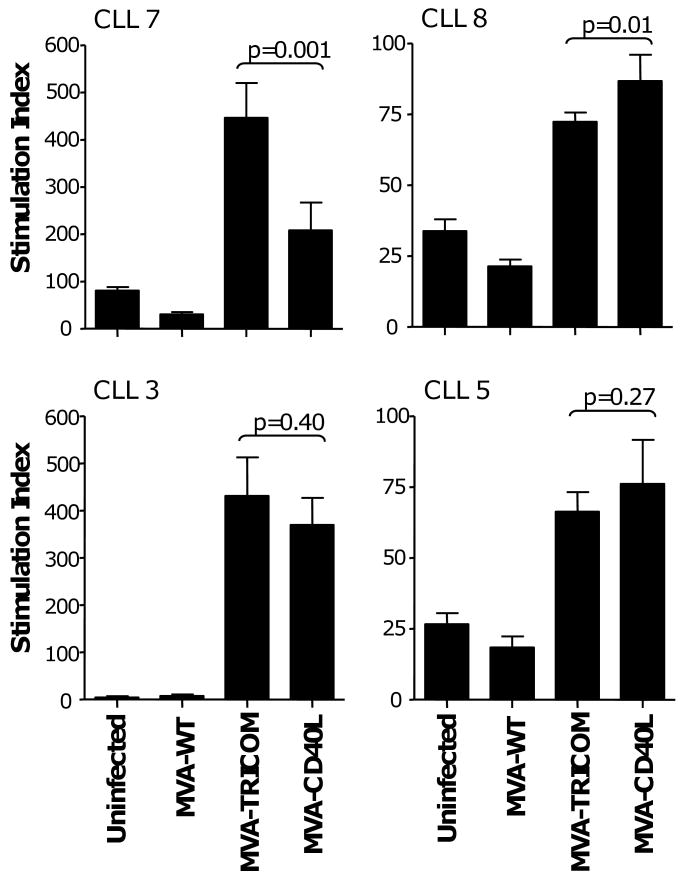
Figure 1. Proliferation of allogeneic normal donor T cells in response to CLL cells infected with MVA-TRICOM or MVA-CD40L.
CLL cells from 4 patients were infected with MVA-WT, MVA-TRICOM, or MVA-CD40L. Following 24 hours of infection, CLL cells were washed, irradiated, and cocultured with allogeneic CD3+ T cells from a healthy donor at a ratio of effector to stimulator cells of 10:1. Error bars indicate the standard deviation of replicate measurements. Note that, due to variability in responses, different scales were used on the graphs.

