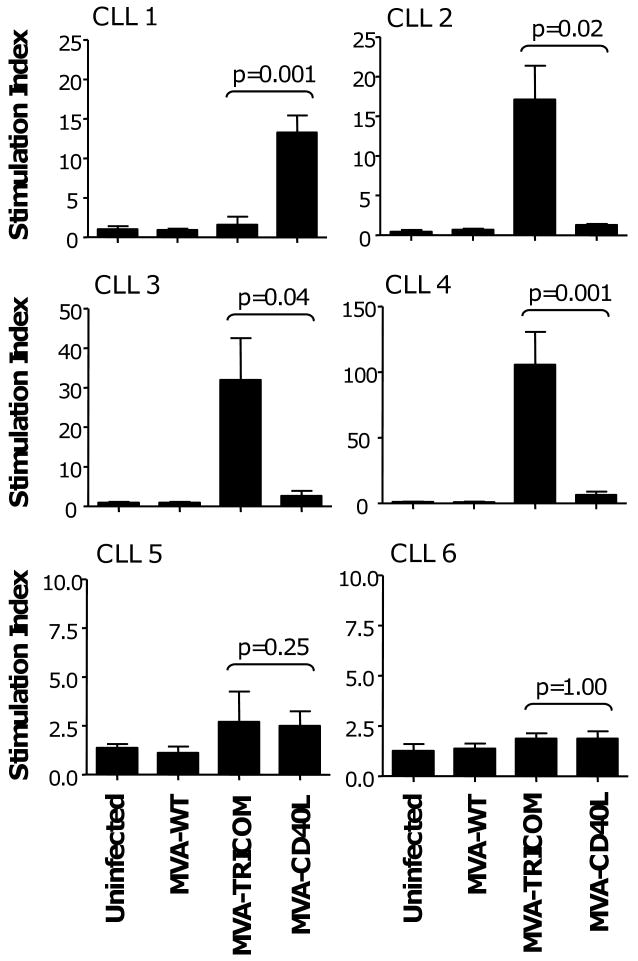
Figure 3. Proliferation of autologous patient T cells in response to irradiated CLL cells infected with MVA-TRICOM or MVA-CD40L.
CLL cells from 6 patients were infected with MVA-WT, MVA-TRICOM, or MVA-CD40L. Following 24 hours of infection, CLL cells were washed, irradiated, and cocultured with autologous CD3+ T cells at a ratio of effector to stimulator cells of 2.5:1. Error bars indicate the standard deviation of replicate measurements. Note that, due to variability in responses, different scales were used on the graphs. Costimulatory molecule expression by the CLL cells following infection is shown in Table 1.

