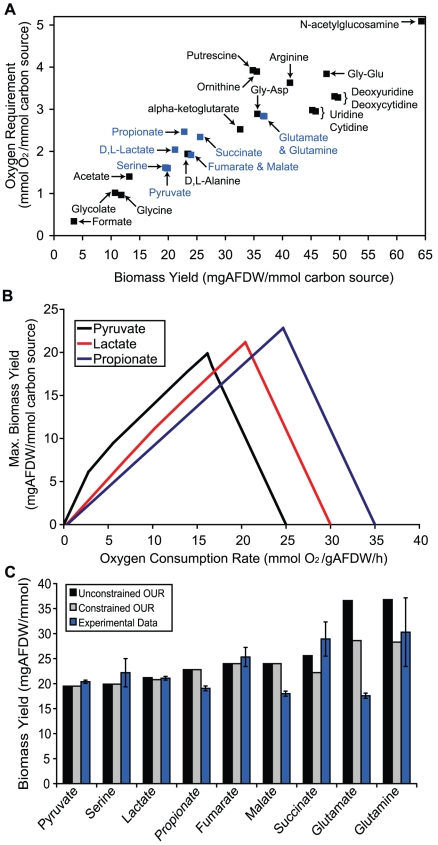
Figure 3. Oxygen requirements for maximal biomass production.
Panel A shows the maximal biomass yield and oxygen requirements needed to achieve the maximum biomass yields for 30 of the 33 model predicted carbon sources (not shown are fatty acids which lie outside of the region shown, see Table S5 for complete list of values). Blue points correspond to carbon sources that were evaluated experimentally. Panel B shows how the maximum biomass yield is affected as the O2 consumption rate is increased and decreased from its optimal value. All three carbon sources have the same number of carbon atoms, but pyruvate requires the least amount of oxygen and under oxygen limitations will have higher biomass yields than the other two carbon sources. All simulations were done assuming a carbon source consumption rate of 10 mmol ATP/(g AFDW•h). Panel C compares calculated biomass yields with experimental biomass yields as estimated from batch growth in a microplate reader. The model predictions were made assuming a carbon source consumption rate of 10 mmol ATP/(g AFDW•h) with either an unconstrained OUR or a maximum OUR of 20 mmol ATP/(g AFDW•h), based on maximal estimates for E. coli [47].

