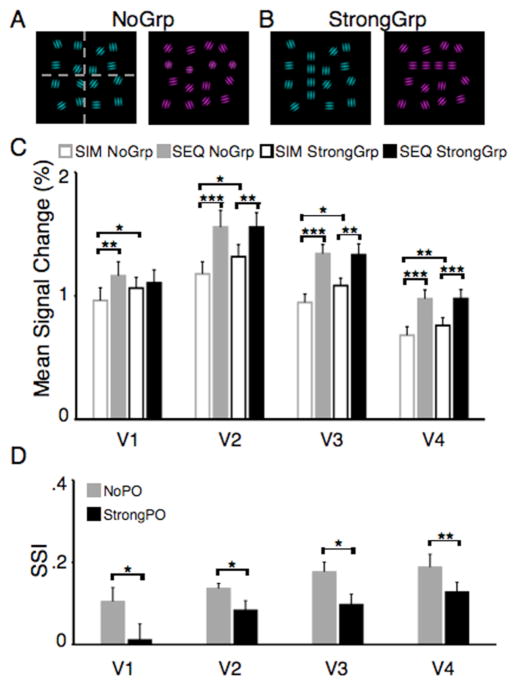
Figure 4. Visual stimuli and fMRI results for the collinearity experiment.
In the collinearity experiment, stimuli consisted of 16 gabors. In the SEQ condition, one fourth of the stimulus was presented at a time (A, gray dashed line). The orientation of the gabors was either random (A), or four of the gabors were aligned (B) forming a horizontal or vertical line. (C) Mean signal changes for each area, defined as described in Fig. 2 (n=12). (B) Sensory suppression indexes for the two perceptual organization conditions. Vertical bars indicate SEM, *=p<.05, **=p<.01, ***=p<.001.

