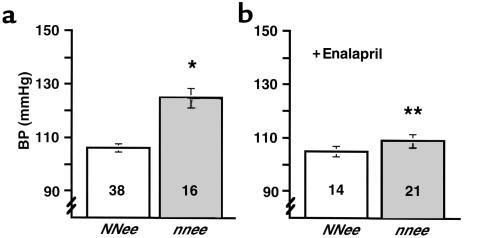
Figure 1.
(a) BP of NNee and nnee mice. An asterisk indicates a significant increase in the BP of nnee animals compared with NNee controls (P < 0.0001). Number inside bar is sample size. (b) BP of NNee and nnee mice treated with enalapril (0.12 g/L drinking water). Two asterisks indicate a significant decrease in BP of nnee animals treated with enalapril vs. untreated animals (P < 0.001) (but not in BP of enalapril-treated vs. untreated NNee animals); (P = 0.75). Error bars represent SE.

