Figure 5.
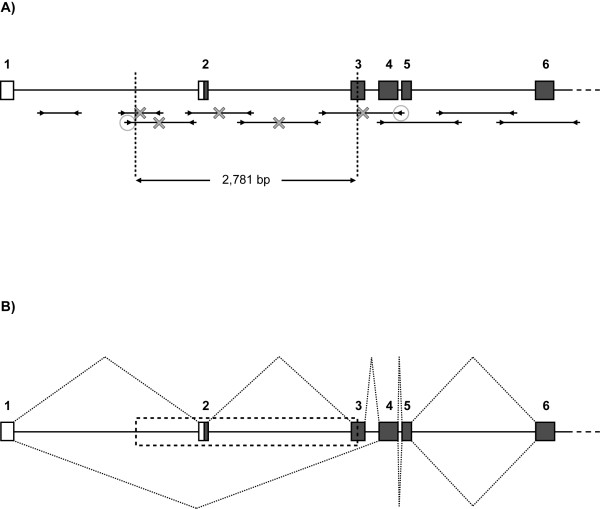
Characterization of the SLC4A2 deletion mutation. Each figure represents the first six of twenty-three SLC4A2 exons in the context of the genomic sequence. Each exon is displayed as a box, with the corresponding exon number indicated above. White coloring represents 5' untranslated region (UTR), whereas gray coloring represents coding sequences; therefore, the black line within exon 2 represents the start codon. Figure 5A depicts the determination of the deletion breakpoint. PCR amplicons designed to characterize the region are shown as fragments below the gene, and arrowheads represent primers. Fragments marked with an X failed to amplify from affected calf samples. The circled primers were eventually used to amplify across the breakpoint in affected calves. Direct sequencing of the resulting product revealed the breakpoint locations indicated by dashed vertical lines. Comparison with the normal SLC4A2 genomic sequence determined a deletion size of 2781 bp, as indicated. Figure 5B depicts the effect of the deletion mutation on splicing of SLC4A2 transcripts. The dashed box represents the genomic sequence missing from affected calf samples. The dotted lines above the gene reflect splicing of normal transcripts; splicing proceeds from exon 1 to 2 to 3 to 4, and so on. The dotted lines below the gene reflect splicing of mutant transcripts; due to deletion of exon 2 and the splice acceptor for exon 3, splicing proceeds from exon 1 to 4, and so on. Both transcript types were produced by a confirmed carrier cow, as detected by 5' RACE.

