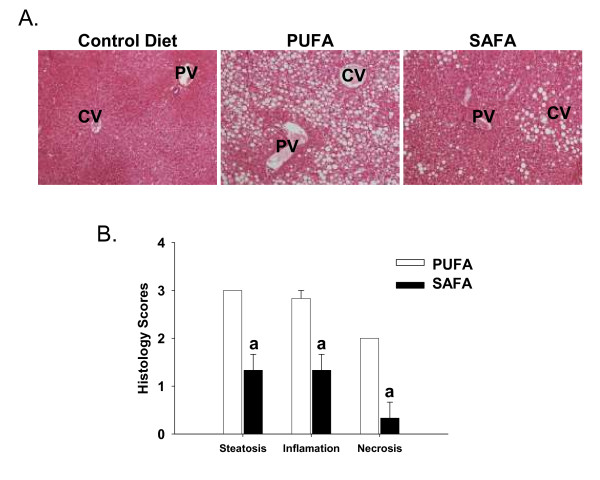
Figure 1.
Hepatic histopathology. (A). Representative H&E-stained photomicrographs of livers obtained from Db mice after 8 weeks of feeding control diet (CD), corn oil diet (PUFA) or coconut oil diet (SAFA). PV = portal vein; CV = central vein. (B) Summary of histology scores. The following scoring system was used for each parameter. 1 = mild; 2 = moderate; 3 = severe. Original magnification = 20×. Data was analyzed using Student's t test; ap < 0.05 compared to PUFA.

