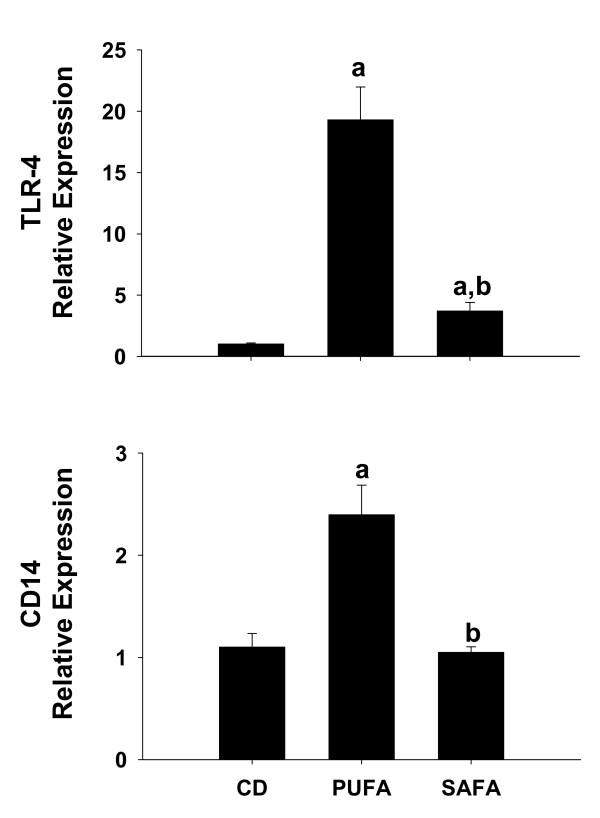
Figure 3.
Expression of TLR-4 and the co-receptor CD14. For assessment of TLR-4 and CD14 expression, livers were collected from male Db mice fed control diet (CD), PUFA or SAFA for 8 weeks. Pre-developed assays for real-time PCR were used according to the manufacturer's instructions (Applied Biosystems). Expression of each target mRNA was calculated relative to average values in the CD group using a comparative CT method and presented as mean ± SEM of 4 observations/group. Statistical comparisons were made using one-way ANOVA. ap < 0.05 compared to control diet (CD); bp < 0.05 compared to mice fed PUFA.

