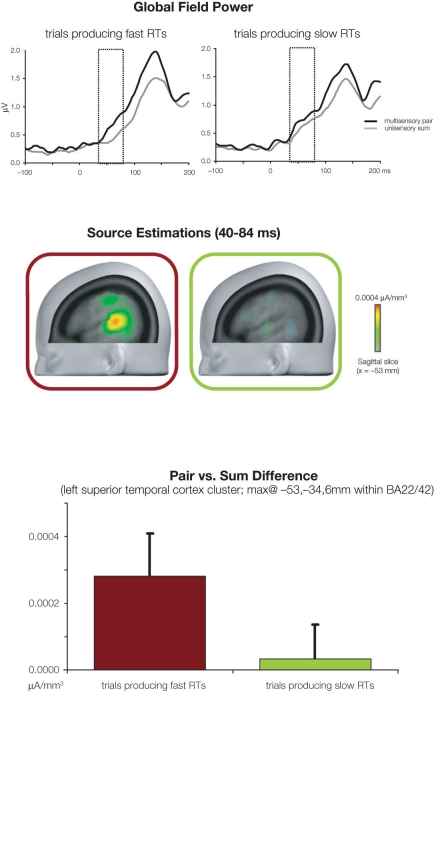
Figure 3.
Evidence for the impact of early non-linear and supra-additive neural response interactions on RT speed. The top panels illustrate global field power waveforms in response to multisensory stimulus pairs, and the summed unisensory responses for trials producing fast and slow RTs (left and right panels, respectively). While non-linear neural response interactions began at 40 ms post-stimulus for trials producing fast RTs, such was only the case from 86 ms onwards for trials producing slow RTs. The middle portion illustrates the difference in source estimations over the 40–84 ms post-stimulus period between responses to multisensory stimulus pairs and summed unisensory responses for trials producing fast and slow RTs (red and green framed images, respectively). The sagittal slice is shown at x = −53 mm using the Talairach and Tournoux (1988) coordinate system. The bottom panel illustrates the mean scalar value of differential activity within a cluster of 25 solution points within the left superior temporal cortex. There were significantly greater non-linear multisensory neural response interactions in the case of trials producing fast RTs.

