
Figure 1.
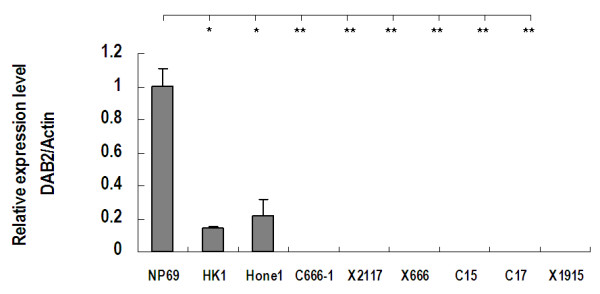
DAB2 mRNA expression in NPC cell lines, xenografts and normal nasopharyngeal epithelial cell line. The QRT PCR was done in triplicate. The error bars represent the standard deviations. P value (* p < 0.05, **p < 0.001) refers to the comparison with normal nasopharyngeal epithelial cell line NP69.