
Figure 4.
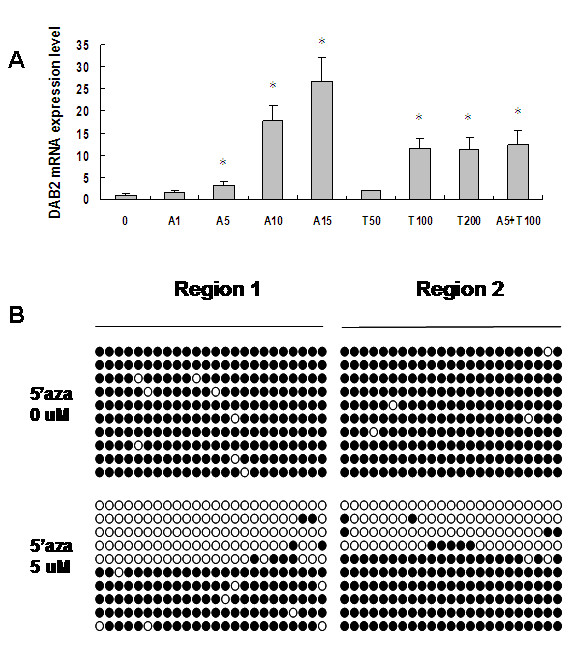
Restoration of DAB2 expression by 5-aza and TSA in C666-1 cells. (A) The relative DAB2 mRNA expression was calculated comparing each sample to no treatment controls. * p < 0.05. A1 - A15, T50 - T200 and A5+T100 refer to the concentrations of A (5-aza) and T (TSA). The treatment protocol has been described in method section. (B) Bisulfite sequencing of DAB2 promoter on C666-1 cells before and after 5-aza treatment.