
Figure 5.
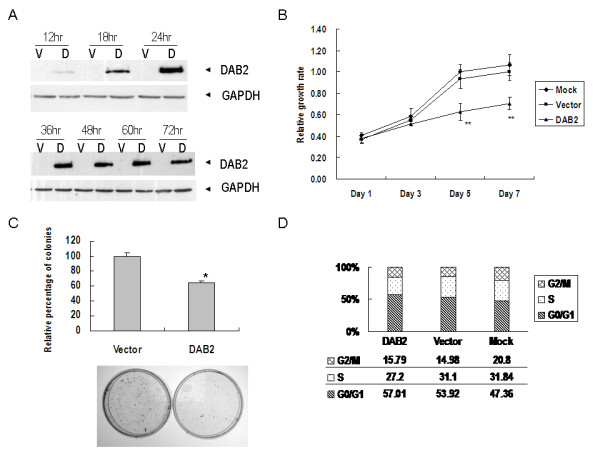
Re-expresssion of DAB2 reduced in vitro growth of C666-1 cells. (A) Western blot analysis of DAB2 transfected C666-1 cells. V: vector control; D: DAB2 transfectant. (B) Cell proliferation as determined by MTT assay. The mean and SD obtained from five experiments were plotted. ** (p < 0.01). (C) Anchorage-dependent colony formation assay. The experiment was done in triplicate and the error bars represent standard deviations. *p < 0.05. (D) Cell cycle distribution of C666-1 cells transfected with DAB2, vector control and mock transfected cells by flow cytometry analysis.