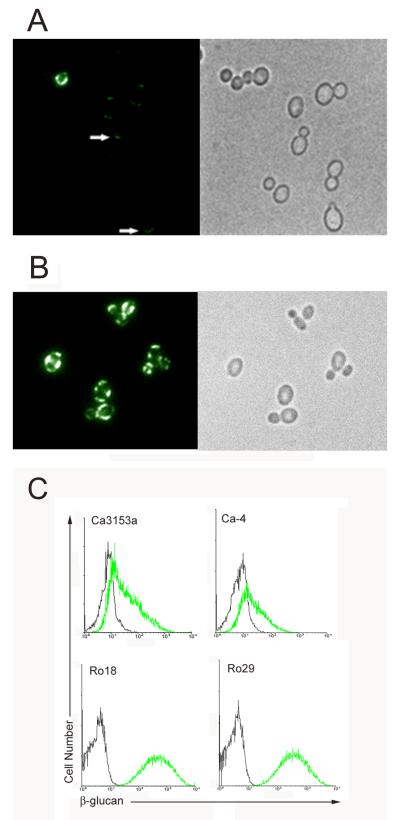
Fig. 2. Indirect immunofluorescence assay and flow cytometric analysis of surface exposed β-glucan.
C. albicans (Ca3153a, Panel A) and C. parapsilosis (Ro18, Panel B) yeast incubated with the β-glucan specific monoclonal antibody, BF-Div. Antibody binding was detected with an appropriate FITC-labeled secondary antibody and viewed by fluorescence microscopy. All strains were tested and showed similar patterns. Representative strains are included in the figure. C. albicans yeast were not labeled uniformly by the antibody, with the majority of cells being either entirely negative or showing faint, localized fluorescence (arrows). In contrast, C. parapsilosis yeast were labeled more consistently and intensely by the antibody, but also with a nonuniform distribution. A phase contrast photomicrograph of the same microscopic field is included. To quantitate antibody binding, C. albicans (Ca3153a, Ca-4) and C. parapsilosis (Ro18, Ro29) yeast cells were labeled with β-glucan specific monoclonal antibody as described above and analyzed by flow cytometry (Panel C). The green line represents staining with BF-Div and the black line represents control yeast incubated with the secondary antibody only. Consistent with the IFA results, increased fluorescence intensity was seen with C. parapsilosis relative to C. albicans.

