
Fig. 10.
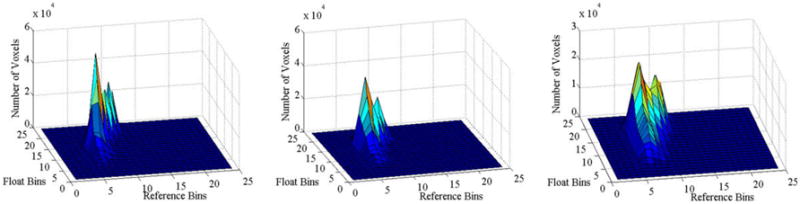
Effect of blurring on joint histogram of intensities. We generated float images by blurring copies of the reference image (in Fig. 1) using 3D Gaussian kernels of standard deviations 1, 2, and 4. We then formed joint histogram, with bin size 40, of intensities across the float images and the reference image. Voxel intensities in each image ranged from 0 to 1000. X-axis and Y-axis plot the bins of intensities in the reference and the float (blurred reference image) images, respectively. The Z-axis plots the number of voxels in each bin. Increasing amounts of blur increased the spread of intensities in the joint histograms. The relation between the intensities across images, however, can be approximated by a nonlinear function.