Fig. 16.


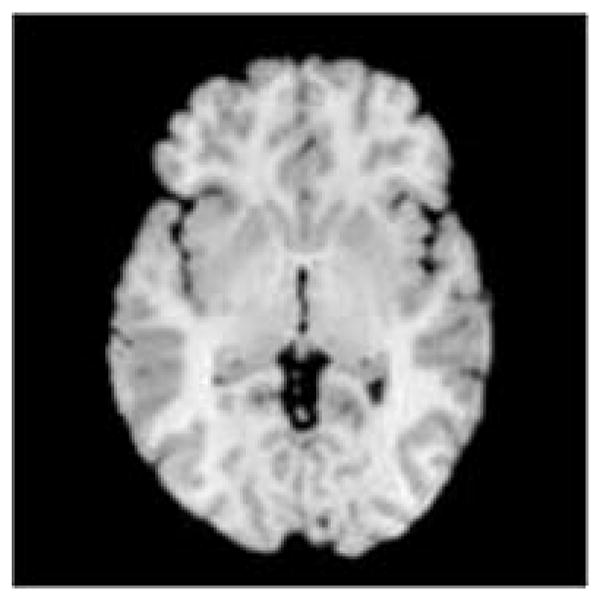
Fig. 16a. The reference brain used to study of the effect varying anatomy on the estimated confidence region for the coordinates of the AC and PC. The reference brain was rotated into the Talairach space and the axial slice containing the AC and PC is shown.
Fig. 16b. Differences versus 68.5% confidence intervals of the X-, Y-, and Z-coordinates of the AC point delineated in the reference and 168 brains registered to the reference. Differences in the coordinates of the AC identified in the reference brain and the other 168 brains are plotted against their confidence intervals. Differences in the X and Z-coordinates are small, indicating that the images are well registered along the left to right and inferior to superior directions. Larger differences in the Y-coordinate are indicative of the anatomical variability along the anterior–posterior direction across individuals. Because the brains were well registered to the references, differing confidence intervals are caused by differing anatomy and differing amounts of noise across individuals. On the other hand, the confidence intervals did not correlate with the differences in coordinates because of the inaccuracies in identifying manually the AC across individuals.
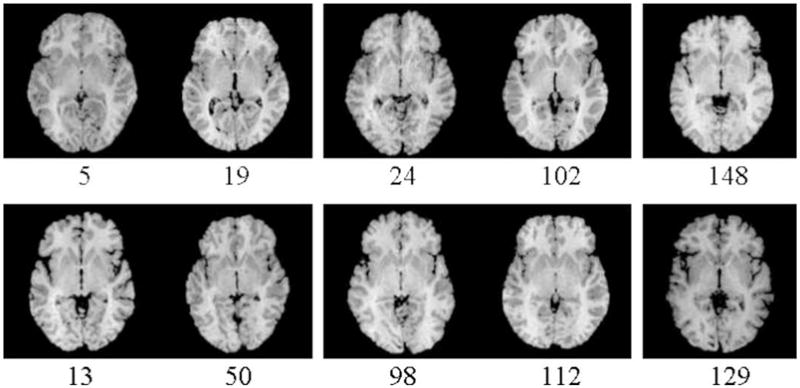
Fig. 16c. Axial images through the AC–PC plane in a representative set of 10 individuals before they were registered to the reference brain (Fig. 16a). In the images registered to the reference image, we computed the differences in X-, Y-, and Z-coordinates of the AC point in the individual and the reference images. The difference was ±1 voxels for the X- and Z-coordinates, and ±2 voxels for the Y-coordinate. The images in the top row have larger amounts of both motion artifacts and noise than the images in the bottom row.
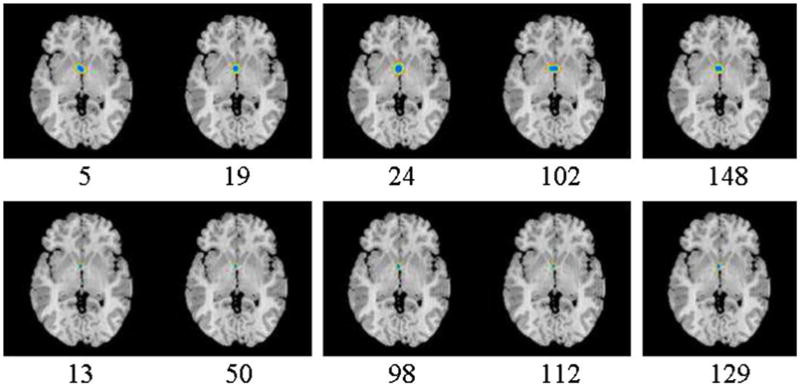
Fig. 16d. Confidence region of the coordinates of the AC for 10 example individuals (Fig. 16c). The confidence regions are superimposed on the slice 73 (slice containing the AC and PC) from the reference image (Fig. 16a). Blue: region of 68.5% confidence; green: region of 95% confidence; orange: region of 99% confidence. In the images numbered 5, 19, 24, 102, and 148 (top row), the average 68.5% confidence intervals of the X-, Y-, and Z-coordinate were ±3.93, ±3.21, and ±1.91 voxels, respectively. In images numbered 13, 50, 98, 112, and 129 (bottom row), the average 68.5% confidence intervals were ±1.8, ±2.0, and ±1.55 voxels for the X-, Y-, and Z-coordinates. The images in the top row have larger amounts of both motion artifacts and noise than the images in the bottom row. Confidence regions are larger for images with larger amounts of noise and differing anatomy than the reference image. (For interpretation of the references to colour in this figure legend, the reader is referred to the web version of this article.)
