Fig. 6.


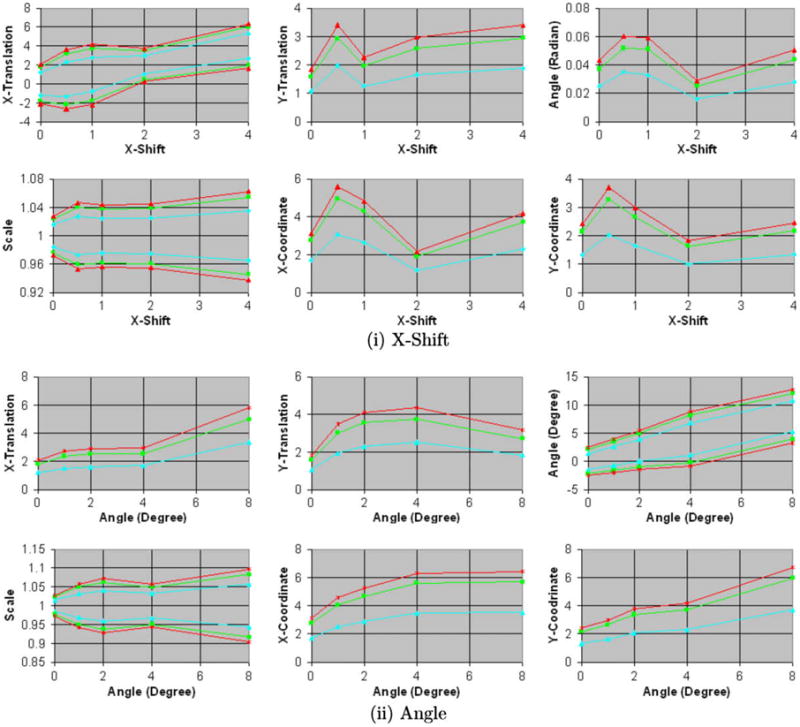
Fig. 6a. Confidence intervals of the coordinates (0, 0) and parameters for similarity transformation using image from two individuals. The confidence intervals for X- and Y-coordinate, X- and Y-translation, and X-shift are in voxels. Simulated float images were generated by (i) translating and (ii) rotating by increasing amounts the copies of the float image. The size of the confidence regions increases for increasing amounts of misregistrations and is larger than those estimated using images from single individual (Fig. 5a). Blue: region of 68.5% confidence; green: region of 95% confidence; and orange: region of 99% confidence. For the confidence intervals that are symmetric around 0.0, only the upper limits are shown. (For interpretation of the references to colour in this figure legend, the reader is referred to the web version of this article.)
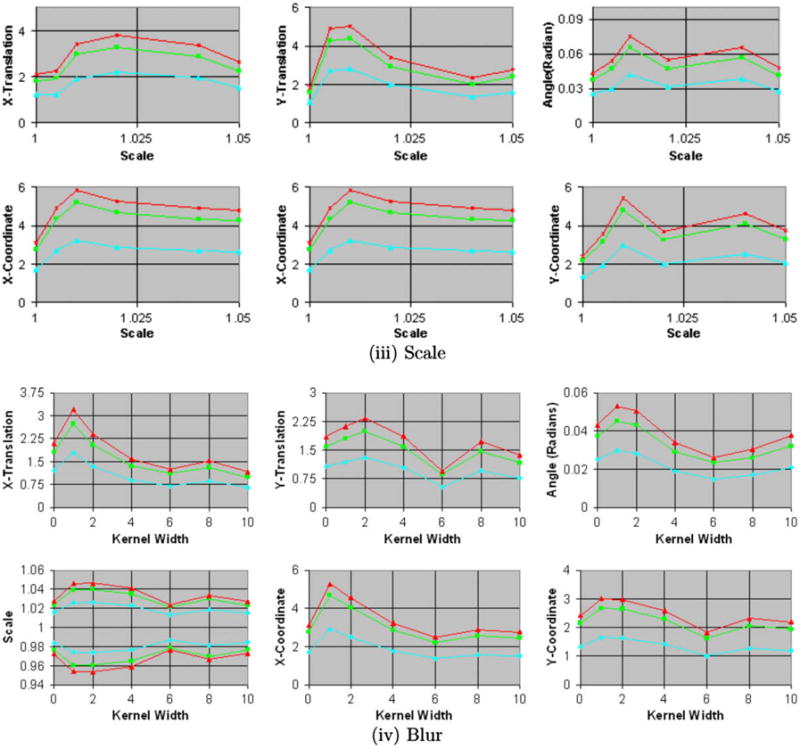
Fig. 6b. Confidence intervals generated using simulated float images for increasing amounts of (iii) scale and (iv) blur in copies of 2D float images. The confidence intervals for X- and Y-coordinate, X- and Y-translation, and X-shift are in voxels. The size of confidence intervals tends to decrease for increasing amounts of blur in the simulated float images.
