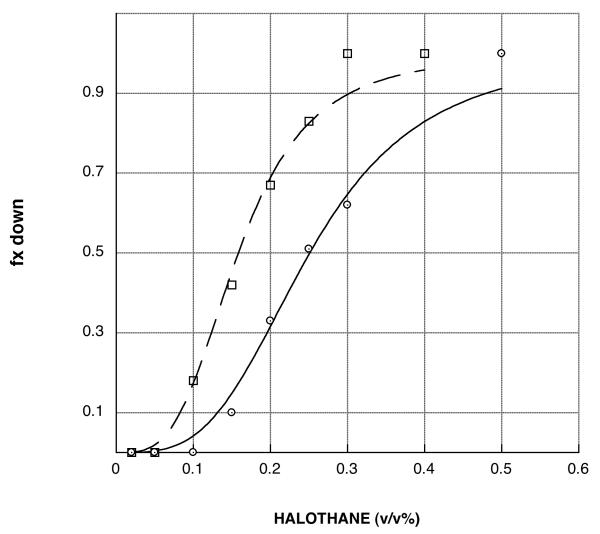
Figure 1.
Representative halothane concentration-response curves. The fraction of flies that are unable to climb out of the bottom of the testing tube during a one minute period are plotted as a function of the concentration of halothane with which they were equilibrated. The curves are fit as described in Materials and Methods to a sigmoidal function. The potency with which halothane interferes with the climbing response is deduced from the midpoint of each curve, i.e, the concentration (EC50) of halothane which is expected to prevent 50% of the flies from climbing. The EC50 value for the Canton-S control strain (open circles, solid line) is 0.26 (v/v%). The other curve shown is for strain JC08 (open boxes, dashed line); it is left-shifted and thus hypersensitive to halothane. The magnitude of this hypersensitivity can be assessed by computing the ratio of EC50 values for the control/mutant strains; for JC08 the potency ratio is 1.66.

