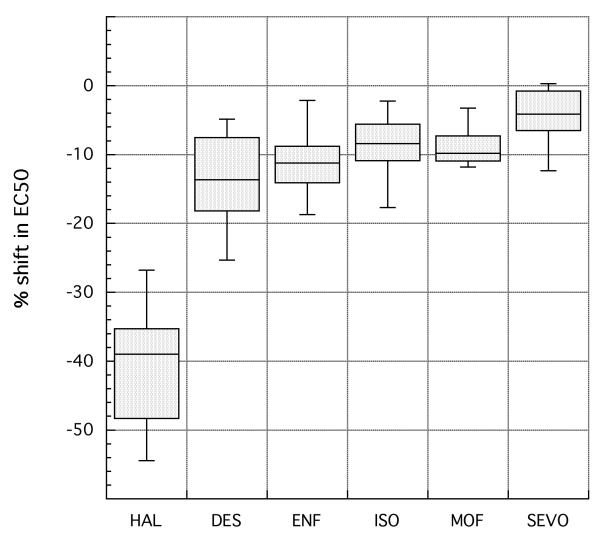
Figure 2.
Altered sensitivity to halothane and five other agents for twelve mutant lines. The mutant lines were those that show moderate to strong effects with halothane (see Table 1). For any given anesthetic, the twelve values for % shift in potency from that of the control line (calculated as in Table I) are arrayed as a boxplot (Sokal and Rohlf, 1995). In such a plot, the shift values are ordered numerically and the box encompasses those values that are ranked from the 25th to the 75th percentile, with the position of the median value marked by a line. Those % shift values that lie outside the box but within an additional 1.5-fold of its range are encompassed by whiskers; although none were found, any outliers beyond this range would have been plotted as individual points.

