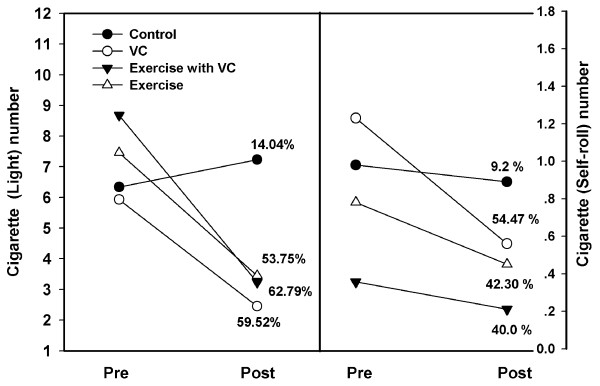
Figure 1.
Cigarette yields per day of light (right) and self-rolling (left) types between pre- and post-intervention periods in each groups, control, VC, exercise with VC, and exercise. Each point represents the mean of cigarette yield per day. The percentage at post-intervention was compared to the pre-intervention.

