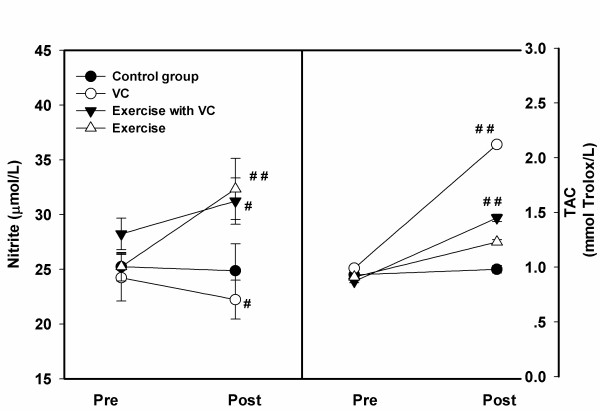
Figure 3.
The levels of nitrite (left) and Total antioxidant capacity (TAC) (right) between pre- and post-intervention periods in each group, control, VC, exercise with VC, and exercise only. Each point represented the mean and standard deviation and significant level at p < 0.05 (#) and p < 0.01 (##).

