
Figure 10.
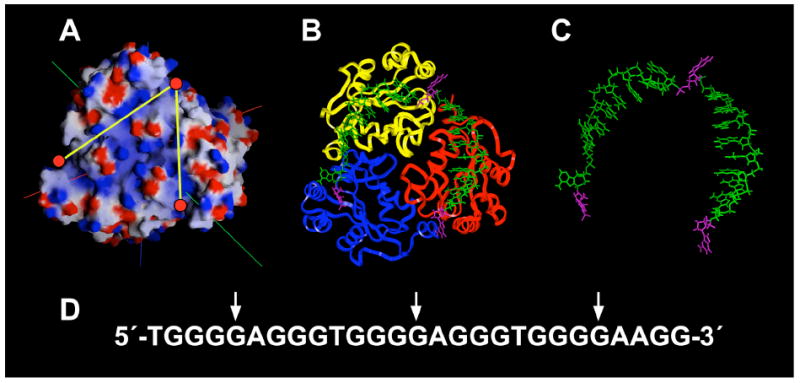
Molecular modeling of NM23-H2 and single-stranded DNA. (A) Calculated electrostatic potential maps for NM23-H2. Red circles indicate the active sites and yellow lines indicate channels of electropositivity. (B) Model of c-myc guanine-rich sequence with NM23-H2. The DNA strand is shown as capped sticks in green, with flipped guanines shown in magenta. A trimer of NM23-H2 is shown as a backbone ribbon (sidechains not shown). (C) DNA strand alone docked on the NM23-H2. (D) The c-myc guanine-rich sequence with arrows indicating the positions of the guanines docked within the active sites of NM23-H2.