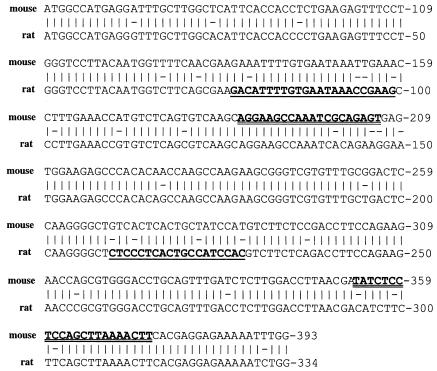
Figure 1.
Alignment of the partial cDNA sequences of rat and mouse PTG. Vertical lines between the 2 sequences indicate identical nucleotides, and horizontal lines indicate nonidentical nucleotides. The oligonucleotide pairs used for amplification of endogenous rat PTG are shown in bold in the rat PTG sequence with a single underline. The oligonucleotide pairs used for amplification of the mouse PTG transgene are shown in bold in the mouse PTG sequence with a double underline. The numbering indicates that nucleotide 1 of the rat PTG sequence (cloned in this study) corresponds to nucleotide 59 of the published mouse PTG sequence (12).

