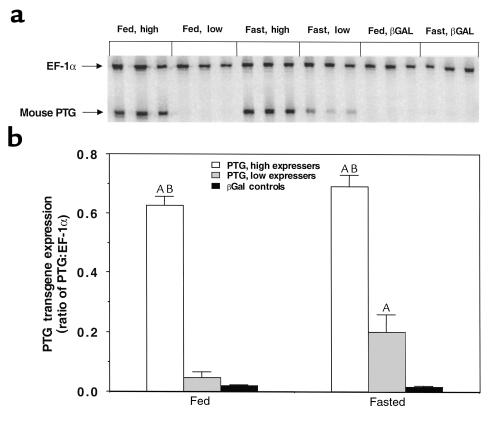
Figure 3.
Expression of the mouse PTG transgene in liver, fasted/fed protocol. Animals received either the AdCMV-βGAL or AdCMV-PTG adenoviruses. Ninety hours after viral administration, animals were either allowed to continue feeding ad libitum or were fasted for 24 hours. Multiplex RT-PCR was performed on liver RNA samples from these animals. Inspection of the data revealed that AdCMV-PTG–treated animals could be segregated into high-expresser (high) and low-expresser (low) groups. (a) Three representative samples for each group are displayed, showing amplification products for the mouse PTG transgene and the internal standard EF-1α. (b) Quantitative analysis of the ratio of PTG/EF-1α signals was performed on all samples by exposing gels to a phosphorimager screen, and processing the resulting scan with ImageQuant. Data represent the mean ± SEM for the following number of samples: fed PTG high expressers, n = 4; fed PTG low expressers, n = 8; fed βGAL controls, n = 6; fasted PTG high expressers, n = 5; fasted PTG low expressers, n = 3; fasted βGAL controls, n = 5. *Values were greater than in the βGAL control group (P < 0.001). #Values were greater in PTG high expressers than in PTG low expressers (P < 0.001).

