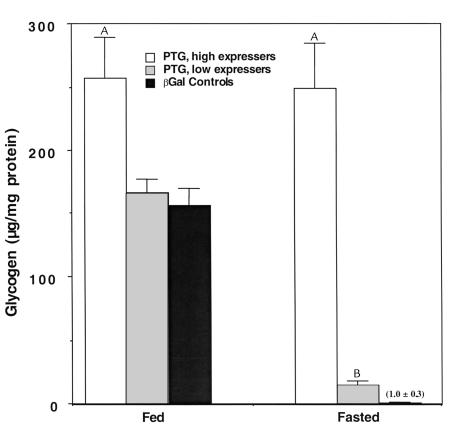
Figure 4.
Liver glycogen levels in fasted and ad libitum–fed rats. Animals were treated as described in the legend to Figure 3, and liver samples were used for measurement of glycogen content. Data represent the mean ± SEM, and the experimental groups and the number of animals in each group are as described in the legend to Figure 3. *Liver glycogen was significantly higher in the PTG high expressers than in either the PTG low expressers or βGAL controls (P < 0.001). #Liver glycogen was significantly higher in the fasted PTG low-expresser group than in the fasted βGAL control group (P < 0.001).

