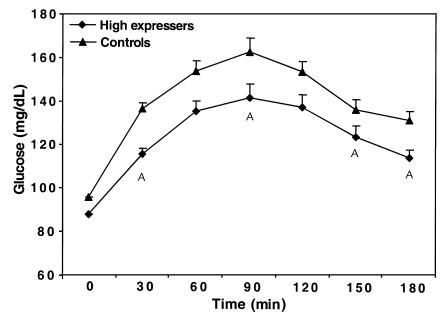
Figure 6.
OGTT. Animals were treated as described in the legend to Figure 5. Plasma glucose concentrations were measured at the indicated times after the glucose bolus. The high-expresser group was as defined in Figure 5. The control group consisted of all AdCMV-βGAL–infused animals and AdCMV-PTG–infused low expressers as defined in Figure 5. Data represent the mean ± SEM for 9 high expressers and 16 animals in the control group. *Those time points at which glucose levels in the PTG high expressers were lower than the control group (P ranging from 0.005 to 0.03).

